Global Drought Monitoring and Prediction System
Is an advanced platform developed by the research team at the Center for Hydrometeorology and Remote Sensing (CHRS). The system provides global SPI-3 drought monitoring from 1980 to near real-time and delivers drought prediction up to 12 months ahead. SPI-3 is computed using PUnetCDR, the latest rainfall estimation dataset produced by CHRS using a U-Net–based AI model and bias-corrected with GPCP. This dataset offers significantly improved accuracy, consistency, and long-term stability, enabling more reliable drought assessment and prediction.
Monitoring
Our drought monitoring system is based on the PUnetCDR dataset, which provides high-resolution and highly accurate precipitation estimates. Because PUnetCDR covers the global domain from 60°S to 60°N, we integrate it with MERRA-2 data and apply GPCP-based bias correction to extend spatial coverage to 90°S–90°N, ensuring a fully consistent and continuous global dataset.
Using this harmonized data record, the system generates near–real-time SPI-3 values for all spatial domains, including countries, political divisions, continental basins, major rivers, tributaries, watersheds, and sub-watersheds. This comprehensive framework allows users to examine drought conditions at multiple geographic scales, from global assessments to localized monitoring.
Additional features include long-term historical records dating back to 1980, interactive map visualization, time-series analysis tools, and automated updates that ensure users always have access to the most current drought information available.
Prediction
Our Drought Prediction Algorithm
We use an advanced AI-driven prediction system to generate SPI-3 (Standardized Precipitation Index) for 12-month ahead predictions for all spatial domains, including countries, political divisions, continental basins, major rivers, tributaries, watersheds, and sub-watersheds. By incorporating complex, spatially detailed climate variables, this system delivers critical insights into future drought conditions.
The Predictive Engine
Our prediction system is powered by a specialized Long Short-Term Memory (LSTM) neural network designed for time-series climate prediction. The model captures long-term temporal dependencies in precipitation patterns and effectively learns seasonal and interannual climate signals. By incorporating an attention mechanism, the LSTM model can focus on the most influential time steps, improving its ability to detect emerging drought trends and produce more accurate SPI-3 predictions.
Input Data and Context
The model requires the last 18 months of historical data as input. To ensure high predictive accuracy and local relevance, we integrate multiple data streams:
1. Historical SPI values:
SPI data calculated from PUnetCDR precipitation records, providing a robust measure of past drought conditions.
2. Exogenous Features:
- Basin-Specific Temperature Anomaly:Instead of a single global temperature value, we use temperature anomalies aggregated specifically for each basin (derived from ERA5 data), which better reflects actual local climate conditions affecting drought.

- Soil Moisture:We specifically utilize data from the 7-28 cm layer of soil moisture, as this layer provides the clearest drought stress signals and is scientifically recommended for SPI prediction.

- Precipitation Anomaly: Deviations from normal precipitation patterns for each basin.
- ENSO Index: NOAA NINA3.4 anomaly to capture large-scale climate oscillations.
Prediction Process
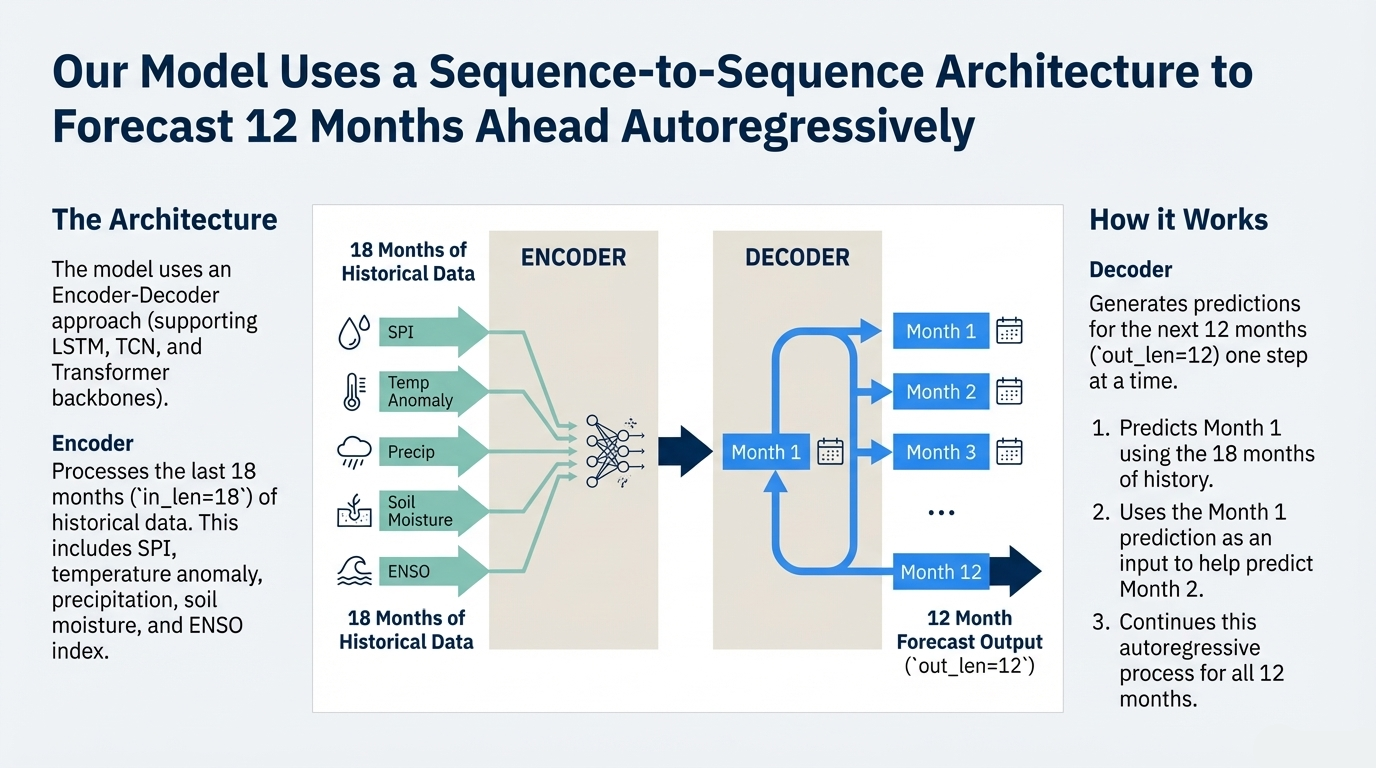
The algorithm generates the 12-month prediction using a sequence-to-sequence, autoregressive approach. This process is sequential: the prediction for the first month is used to inform the prediction for the second month, and so on, continuing for all 12 months.
Since future real-world climate inputs (exogenous features) are unavailable, the system relies on seasonal patterns (monthly averages from the last year) and climatological normals to estimate these features for the prediction period.
Prediction Outputs
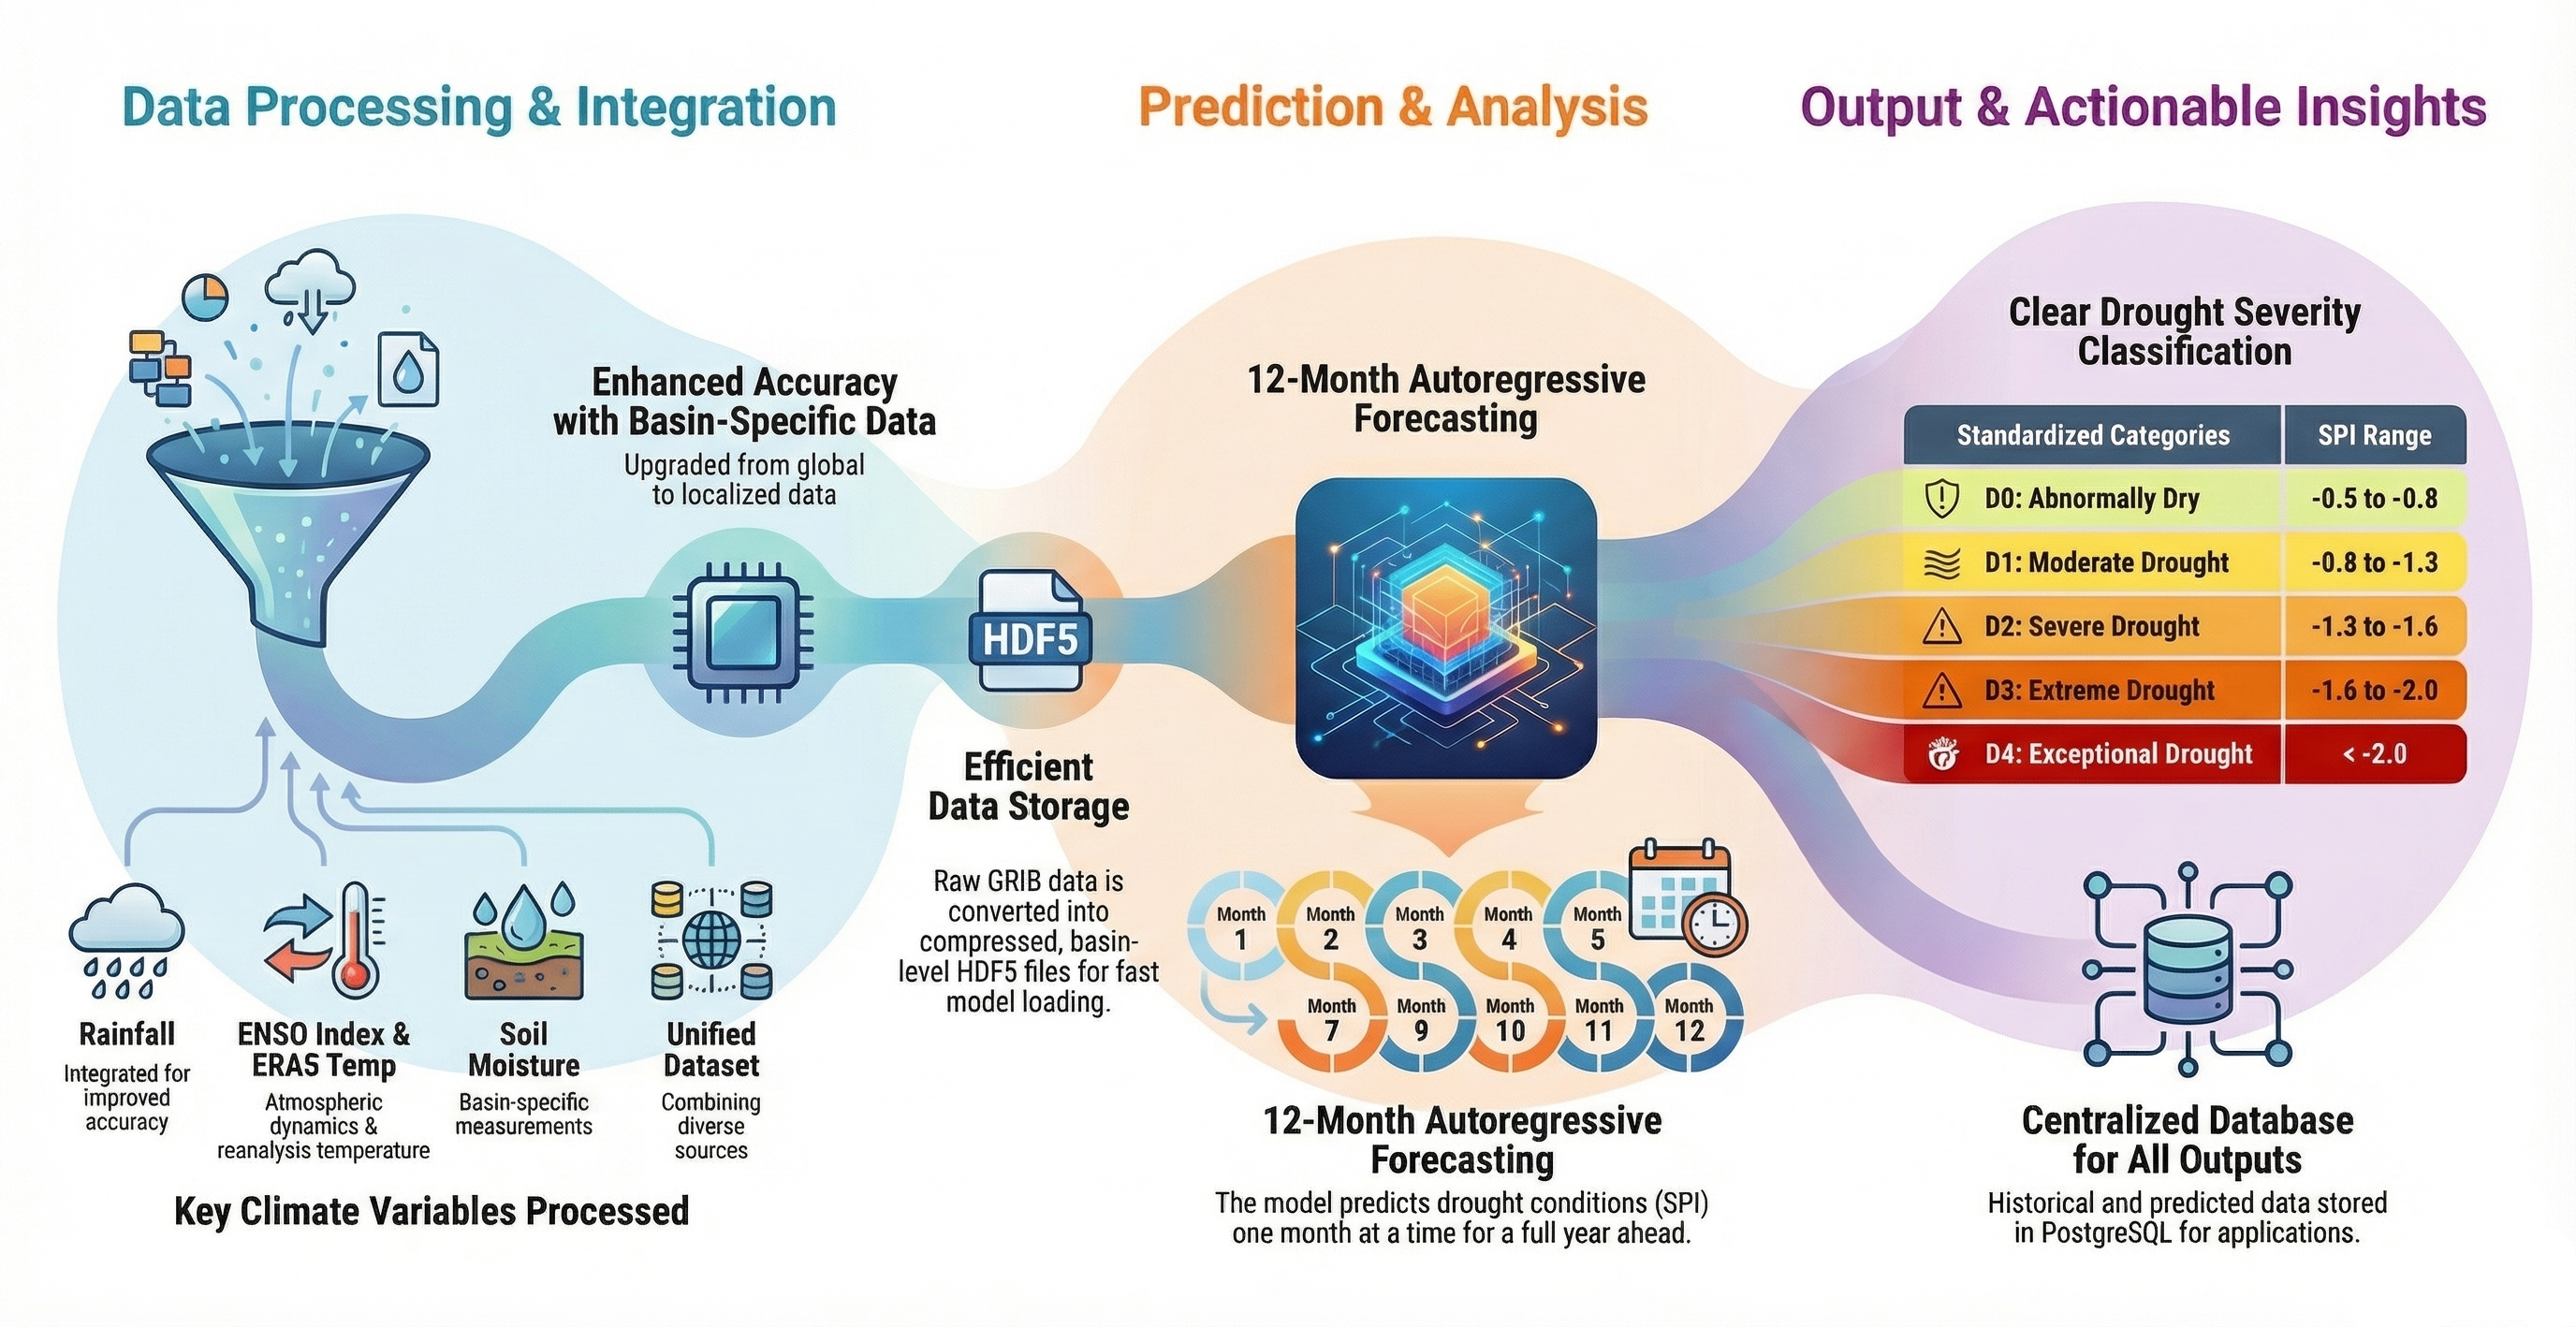
The core output is the Predicted SPI value for each future month, accompanied by a corresponding drought severity classification.
Our system classifies drought into five categories:
| Category | SPI Range | Description |
|---|---|---|
| None | SPI > -0.5 | Normal conditions |
| D0 Abnormally Dry | -0.8 < SPI ≤ -0.5 | Mild drought conditions |
| D1 Moderate | -1.3 < SPI ≤ -0.8 | Moderate drought stress |
| D2 Severe | -1.6 < SPI ≤ -1.3 | Severe drought conditions |
| D3 Extreme | -2.0 < SPI ≤ -1.6 | Extreme drought stress |
| D4 Exceptional | SPI ≤ -2.0 | Most severe drought category |
Important Consideration: Prediction Confidence

Prediction accuracy naturally decreases with longer lead times, a normal and expected feature of time series prediction. Therefore, we advise users to place more confidence in short-term predictions (1-4 months) for critical decisions, and treat the long-term predictions (7-12 months) as trend indicators with inherently higher uncertainty.
The Final Output is a Modern, Interactive Web Application

Our web application provides an intuitive interface for exploring drought predictions across the globe, offering interactive maps, detailed analytics, and real-time data visualization to support informed decision-making.
Advanced Visualization and Analysis Tools
Our platform offers interactive tools designed for powerful data exploration:
Interactive Charts
We feature several chart types, including the Time Series Chart., this chart is optimized to fetch data in a single query, offering up to 6x faster performance than previous methods.
Data Comparison
The comparison feature supports a split-screen layout to compare data across two different years side-by-side, with synchronized map movement.
Country Trend Chart
For selected countries, we provide a dedicated SVG-based trend chart visualizing the 47-year history of Population and GDP, instantly updating as the user scrubs the timeline.
Technology and Performance
The application is built using a modern technology stack, including React 18, Next.js 14+, TailwindCSS, and TypeScript, ensuring a reliable and fully responsive design across desktop and mobile devices.
Key performance features include:
PostgreSQL Database
All vulnerability data is stored in a robust PostgreSQL database with an optimized schema, utilizing connection pooling and specialized functions for efficient data retrieval.
Vector Tiles
To handle massive basin geometry files (which can reach 800 MB originally), we use vector tiles for instant map loading and smooth interactions. This results in a massive 99% reduction in initial map load size.
Data Export Capabilities
We enable users to download analysis results for use in external GIS software:
GeoJSON Shapefile Export
Users can export the current map visualization data (vulnerability values and geometries) as a GeoJSON file. For large basin data, we implement geometry simplification with three quality settings (Low, Medium—recommended, High) to reduce file size by 70–95%. Country exports are always optimized and small (~9 MB).
GeoTIFF Export
We offer export functionality for georeferenced raster files (.tif), ideal for scientific analysis and modeling. Users can select from three resolutions: High (0.025°), Medium (0.1°—recommended), and Low (0.25°), balancing detail and file size. GeoTIFF exports support all data types and spatial scales, respecting active filters.
Our Sponsors
